


Abstract
Tunnel boring projects are both expensive and operationally challenging. Identifying risk factors of operational breakdown (e.g., logistic or material breakdown) from historical data can help mitigate them on future worksite by promoting more optimal choices of engineering. We were tasked to test various candidate hypotheses for explaining the rate and origin of material breakdowns on a tunnel boring project. We performed the analysis in Python (Pyspark) in a Big Data environment (Hadoop/Spark/Zeppelin). The analysis revealed in particular that the ontology programmed in the worksite supervision software did not reflect what was actually happening on site, and suggested several ways to improve both the supervision software and the hardware.
During my time as a data scientist consultant at Bouygues Travaux Publics, I was paired with a civil engineer and tasked to find new ways of using data to optimize civil work projects.
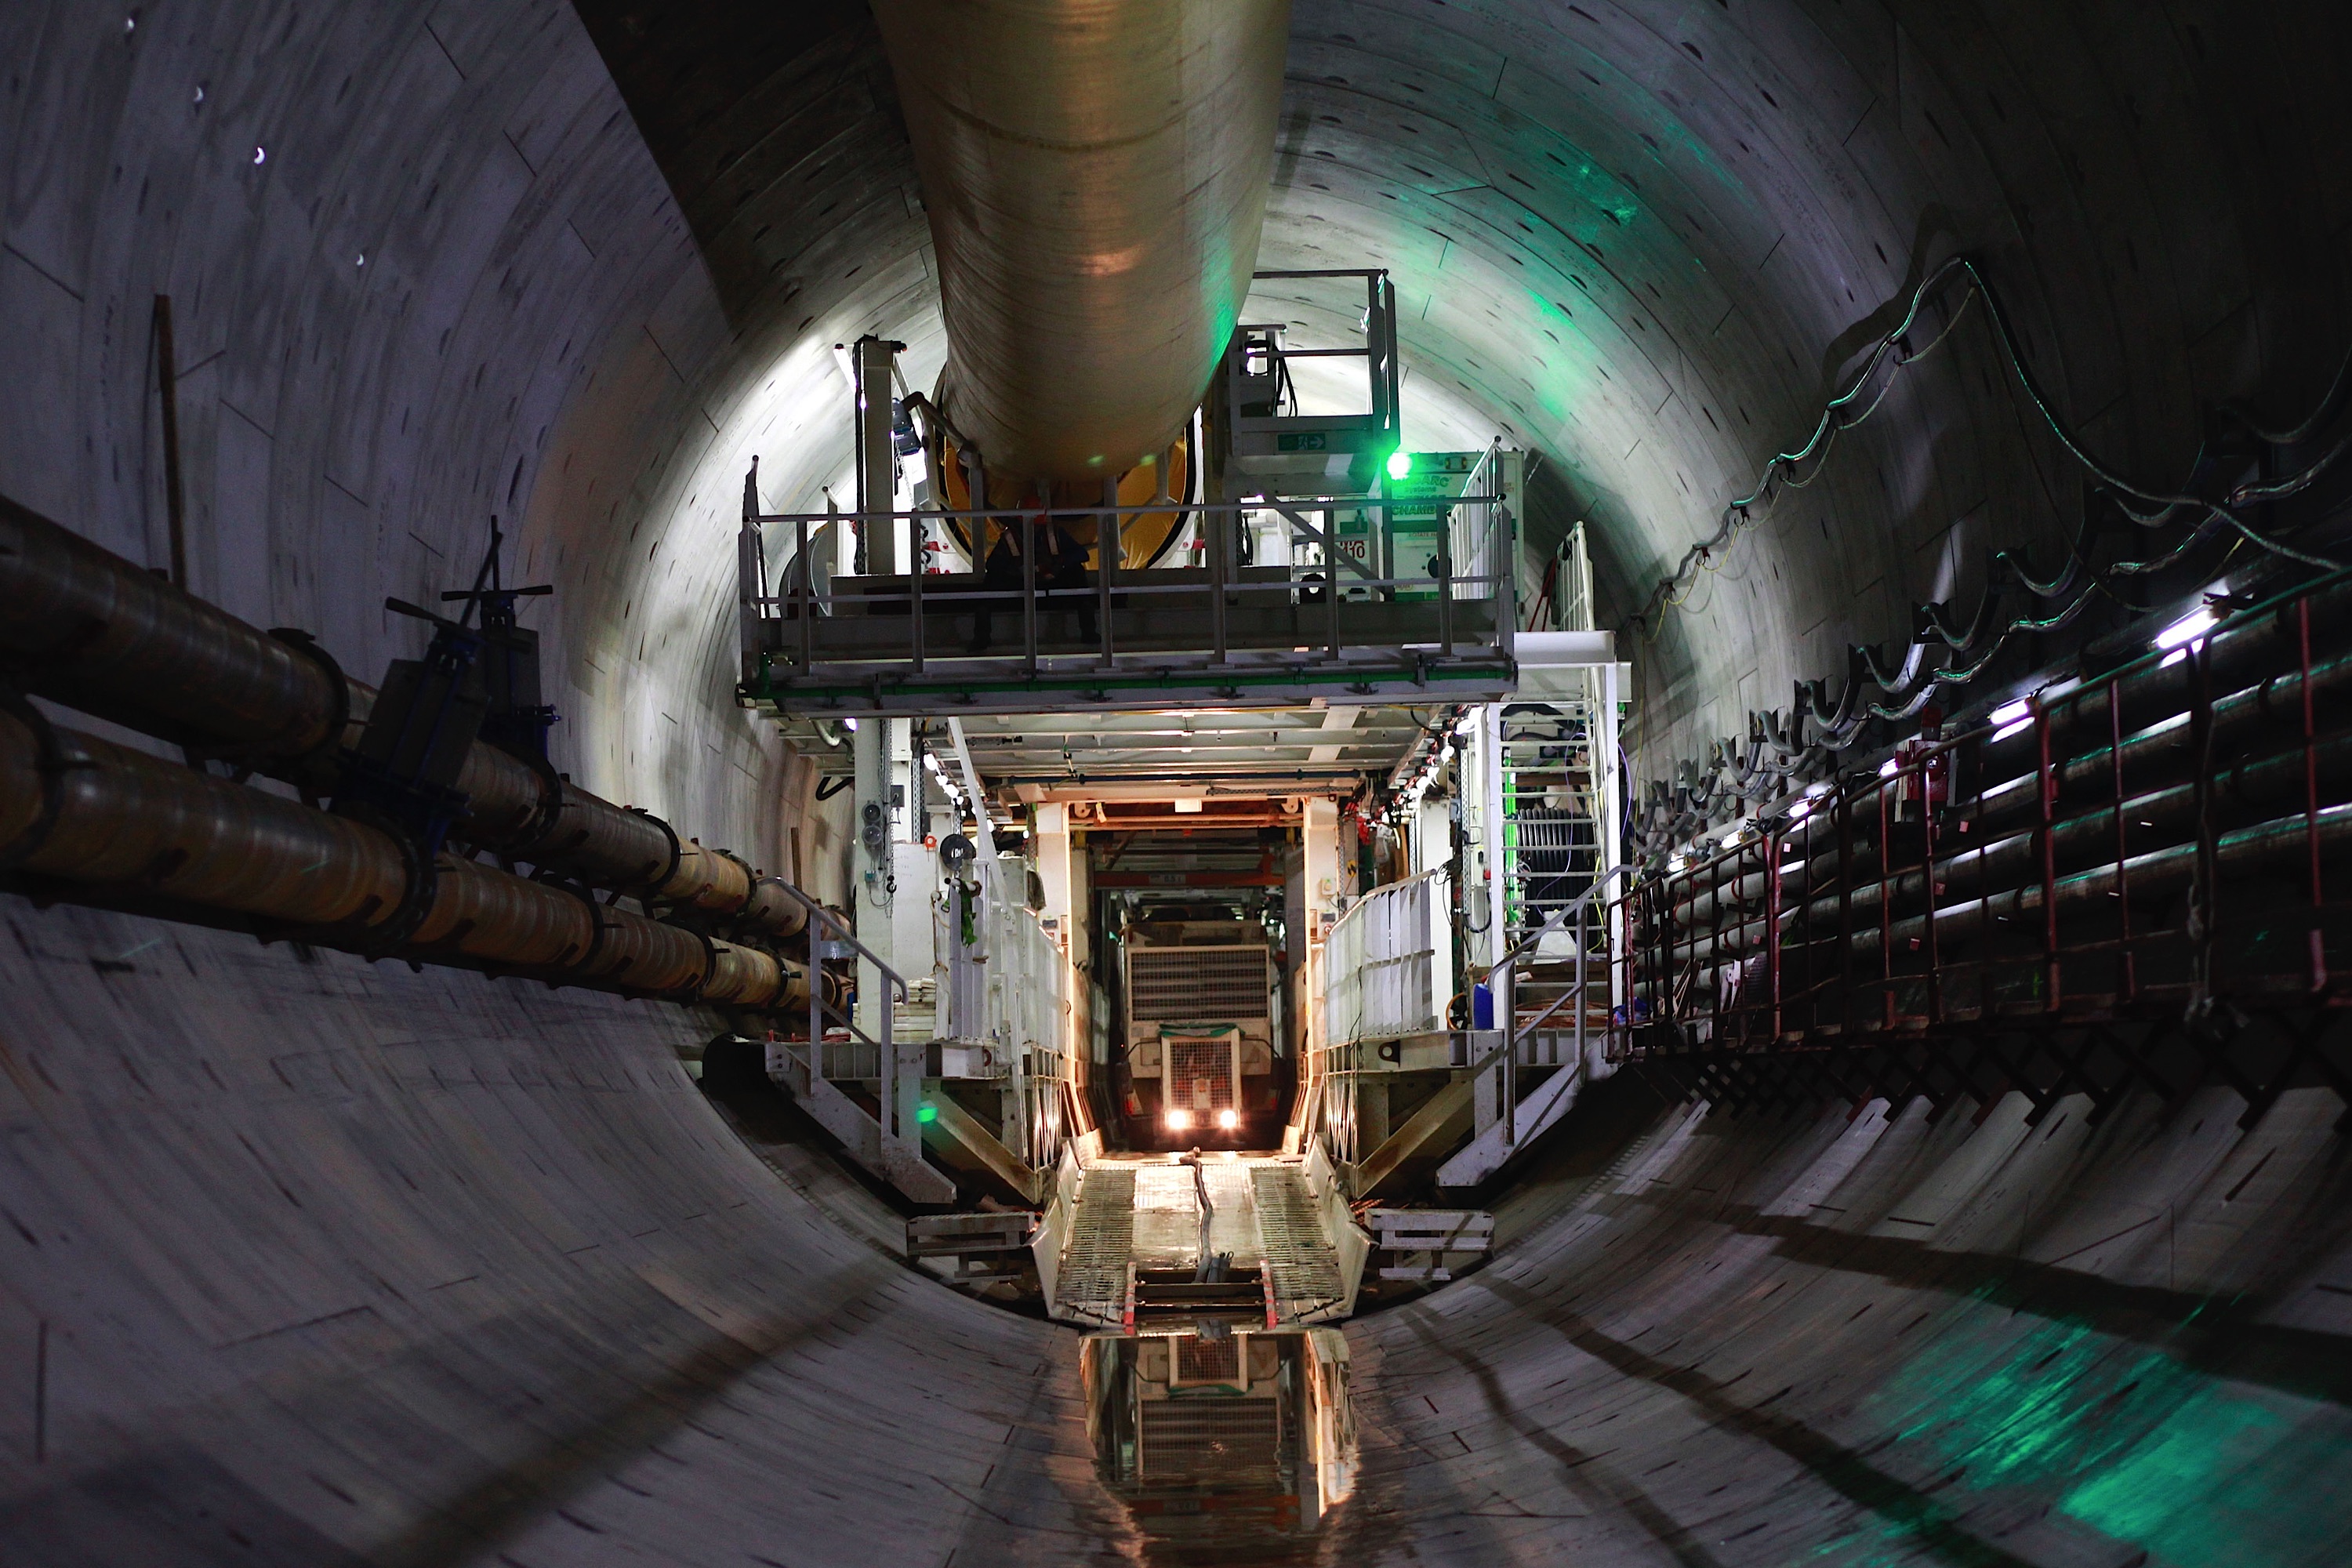
Tunnel boring machines are impressive feat of engineering used to excavate tunnels with cross-section diameters that can range from one meter up to 17 meters. They have been a major tool for the development of modern underground transportation in urban areas (see for example the Tuen Mun–Chek Lap Kok Link road project).
Tunnel boring machines are very complex to operate and depends on several components working together flawlessly. Tunnel boring worksite are at a standstill almost 30% of the time of a project: the sources of operation suspension are many folds: material (i.e., mechanical pieces failure), logistic (e.g., voussoir delivery), and human (e.g., shift change).
One day delay on a typical project can cost up to 50k euros, hence even a small gain in operational efficiency is high stake.
The project
Section titled [object Undefined]One obvious source of operation breakdown is material breakdown. Material breakdowns are logged in the shift report software by the worksite team, who is asked to to classify thems using an established ontology.
We chose to focus on a worksite where a high number of breakdowns had been reported: they all allegedly involved failure of the same mechanical component, at a higher frequency than expected from experience on similar projects.
Our questions were:
- Do shift report logs confirm the implication of the component in the breakdown ?
- Is the topography of the project responsible for an increase risk of failure of the component ?
- How much delay was caused by this failure ?
Data cleaning and processing
Section titled [object Undefined]We had to overcome several challenges to exploit the dataset:
- Shift reports were extracted from a SQL database in the form of two tables (events on one side and kilometer point on the other side) with a common timestamp referential. A nearest timestamp joint strategy was devised to map each event to a kilometer point.
- Inspection of the resulting joint revealed a lot of aberrations (e.g., sections of the worksite with no excavation time). This is because events table timestamp can be corrected post-hoc by the operator. A combination of business logic rules had to be used to retrieve consistent sequence of events. A few “orphean” events had to be excluded from the analysis.
- The resulting tabular dataset was enriched by calculating altitude variation rate and curvature.
Data analysis
Section titled [object Undefined]We used three complementary data analysis approaches, combining statistical investigations with domain knowledge.
Semantic analysis
Section titled [object Undefined]We first sought to cross-validate the high occurence of the aforementionned breakdown with an analysis of the semantics of breakdown description filled in by operators. We tested different methods to vectorize the descriptions, including a Word2Vec autoencoder model trained on the corpus. In the end, a simple Bag-of-words approach was used, followed by a dimension reduction approach to embedd the comments in a two dimensional, t-SNE space. This algorithm preserves both the global structure of the semantic space, and the local similarities between descriptions:
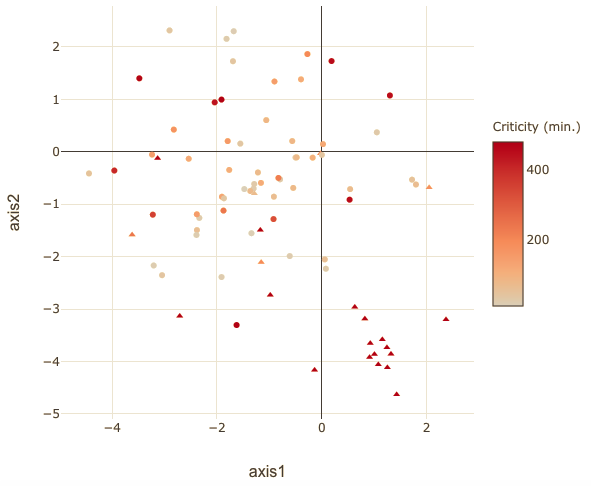
This analysis revealed that ~24% of events reported as “breakdowns” were actually not interrupting the excavation sequence, but were instead related to a operation problem that may contribute in the long run to critical breakdown. Interestingly, these incidents were tightly clustered in semantic space (triangle markers).
More surprisingly, we discovered that ~39% of these breakdowns were wrongly classified: the descriptions allowed to exclude the suspected component as a root cause of the failure. This discrepancy between breakdown ontology and descriptions was further confirmed by repeating the analysis on another worksite, which revealed little semantic overlapping.
Thus, it appears that breakdowns with different root causes can be incorrectly qualified as being of the same type.
Bootstrap resampling for hypothesis testing
Section titled [object Undefined]Interactive data vizualization of type and duration of breakdown superimposed on the boring route suggested that some of the breakdowns could be caused by the topography of the terrain:
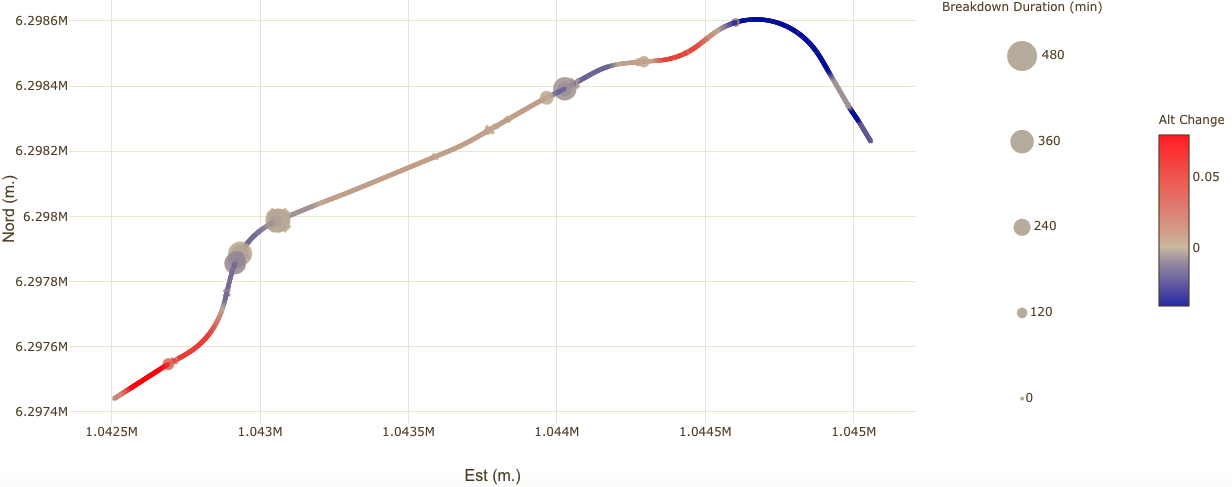
We directly tested this hypothesis by using a bootstrap resampling approach. A bootstrap procedure allow to test an hypothesis by simulating a null hypothesis with samples of the observed data. In this case, we generated ten thousands samples by shuffling the coordinates of all breakdowns that were recorded in the shift report: in these bootstrap samples, the link between the type of a breakdown and its precise GPS location is lost, while the structure of the original “breakdown space” (i.e., the overall number and repartition of the breakdowns along the boring route) is preserved.
The mean altitude change and curvature associated with the breakdown of the component is calculated for all samples: this represents the altitude change or curvature distribution solely expected by chance given the topography of the terrain. If breakdown of the component is independent of altitude or curvature, then the actual value will not be statistically different from the distribution of the bootstrap samples. Conversely, if the observed value is higher than in the bootstrap samples, then one can consider that breakdown of the component is associated to altitude change or curvature, with a certain level of statistical risk (usually 5%).
Contrary to intuition, this analysis revealed that there was no statistically significant relationship between the breakdown of the component and the topography of the terrain.
Correlation with sensor data
Section titled [object Undefined]Finally, we sought to correlate our findings with tunnel boring machine sensor data. Tunnel boring worksites operated by Bouygues TP centralize data in a “Worksite data hub” that is used in real time for predictive modeling and retrospective analysis of operation efficiency.
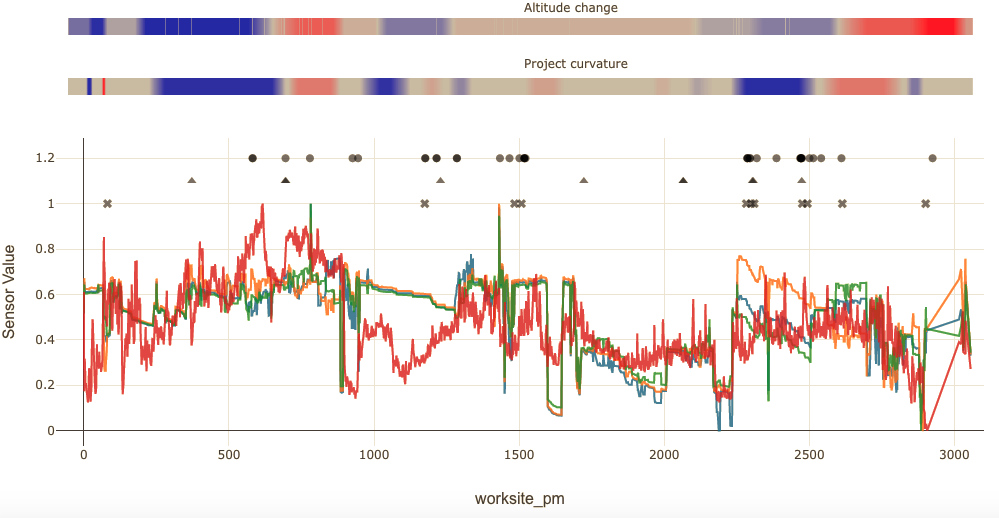
We set up a processing tool in Python to synchronize extracts from these data sources and set up jupyter notebooks for interactive data exploration.
This allowed to cross-validate some of the breakdowns by inspection of sensor data.
Conclusion
Section titled [object Undefined]This project brought several insights:
- Semantic analysis revealed that breakdown ontology in place did not accurately reflect breakdown causality: comparisons of breakdowns of the same type between two different worksite pointed to different root causes of failures.
- Qualitative analysis suggested that the topography may be involved, though this could not be statistically confirmed. Analysis of the logs suggested instead that operation of the device itself may have been inappropriate.
- We estimated that at least 24 hours had been lost due to this breakdown.
We also made the following recommendations:
- Encourage operators to thoroughly describe breakdowns, as the ontology used in the system may hide true root causes.
- Guarantee data integrity by disallowing post-hoc alteration of shift report logs.
- Adopt a common timestamp referential for shift report data and tunnel boring machine sensor data.