


Abstract
Electronic noses measure more than a dozen atmospheric parameters to monitor air quality or odor nuisance. An environmental event (e.g., pollution, odor) is characterized by a distinct response pattern in this array of sensors. However, the different types of events can not be a priori known, hindering efficient reporting or predictive modeling at project launch. We implemented a data processing pipeline to streamline the identification, characterization, and clustering of such events from e-nose time series. The pipeline, combining a peak detection algorithm, dimensionality reduction techniques and multivariate Gaussian modeling, was deployed as a Python package and the API documented. Additionaly, an interactive user interface written in Dash was deployed on a JupyterHub server to allow in depth no-code analysis of multivariate electronic nose data.
2024-10-14 UPDATE
I have open sourced the core functionalities described below in a dedicated Python package:
One of the first problem I had to tackle as an R&D engineer in synthetic olfaction was to find ways to exploit the data from “surveillance” electronic nose: these devices are freely sampling open air or indoor environments for the purpose of identifying extraordinary “events”, and report them to stakeholders.
These can range from single dimension events, such as nitrogen dioxyde (NO2) or particulate matters (PM) pollution events, to events that are defined by their multisensory signature, such as odor pollution events.
This area of applications was the most challenging for our Customer Success team because:
- We could not rely on any labelled events to train the e-nose to detect, hence ruling out straightforward supervised learning approaches.
- The environmental conditions were not controlled, hence micro-sensors could pick-up a variety of perturbation of varying relevance, unbeknownst to us.
- Each environment and application is unique, hence using a generic, offline trained anomaly detection model was impractical.
The follow-up of these projects required extensive supervision of customer data from our team, fishing for meaningful signal across multiple sensor dimensions, and getting as much feedback as possible from customers (who in most cases were not analytics experts and often not even on site).
We thus set out to devise an approach to streamline this arduous data analysis process.
The problem
Section titled [object Undefined]Our goal was to devise a tool for anomaly detection with the following requirements:
- The method should be applicable to any environment.
- It should handle multidimensional signal to leverage all the information picked up by the microsensor array of the electronic nose.
- Sensitivity criteria should be adjustable by the customer support engineer.
- Output of the tool should be directly exploitable by the customer support engineer.
The solution
Section titled [object Undefined]We built a Python toolbox to assist engineers in detecting, quantifying, and characterizing “events” recorded by freely sampling electronic noses.
The whole pipeline consisted in pure Python routines for API calls, data processing, and anomaly quantification methods, wrapped in a Dash app for enjoyable user experience.
In this interface, the engineer could:
-
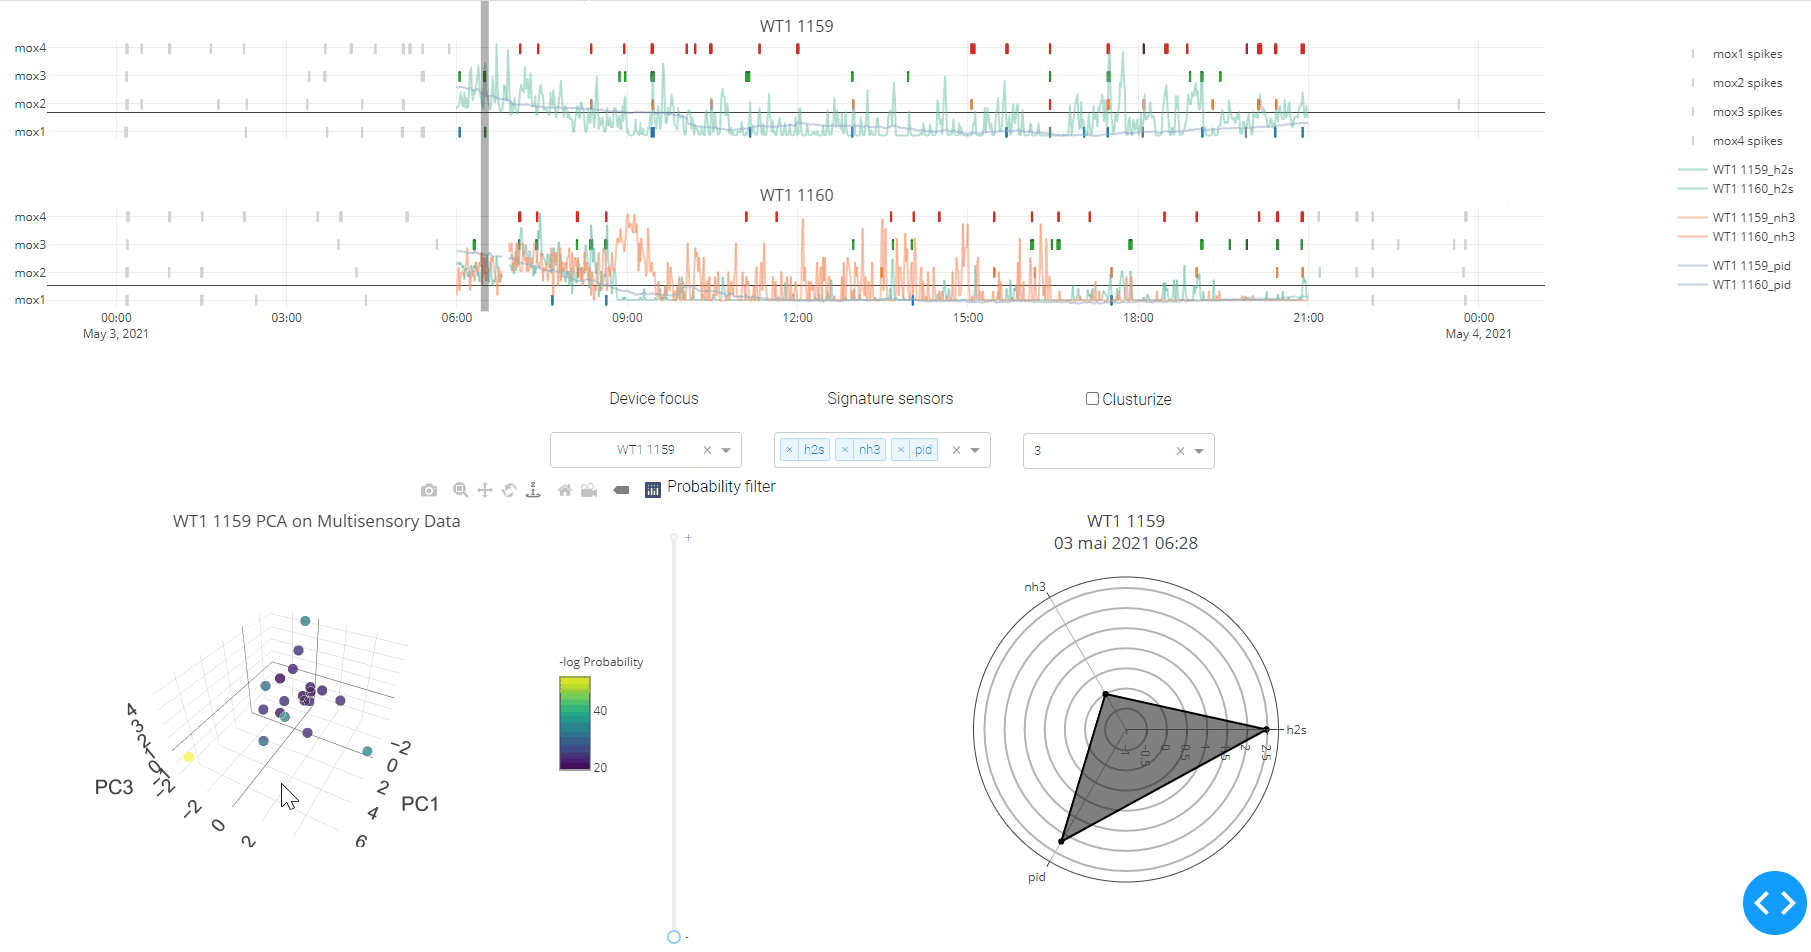
Load data through a calendar plugged into the API. A peak detection algorithm1 using departure from a local, sliding baseline was used to detect statistically significant perturbation in MOX sensor2 signals.
-
Filter data using a timeline and various dropdown to overlay and compare signal from different sensors and devices onto peaks. This step was important to decide which sensors and time periods to keep for the subsequent multivariate analysis.
-
Reproject the data in latent space: A principal component analysis was used to reproject the data in the most optimal axes of variations. This effectively suppress colinearity in sensor signals, and allow for further noise canceling.
-
Explore, score, and cluster environmental events:
- Events could be represented in Principal Components3 or t-SNE4 space.
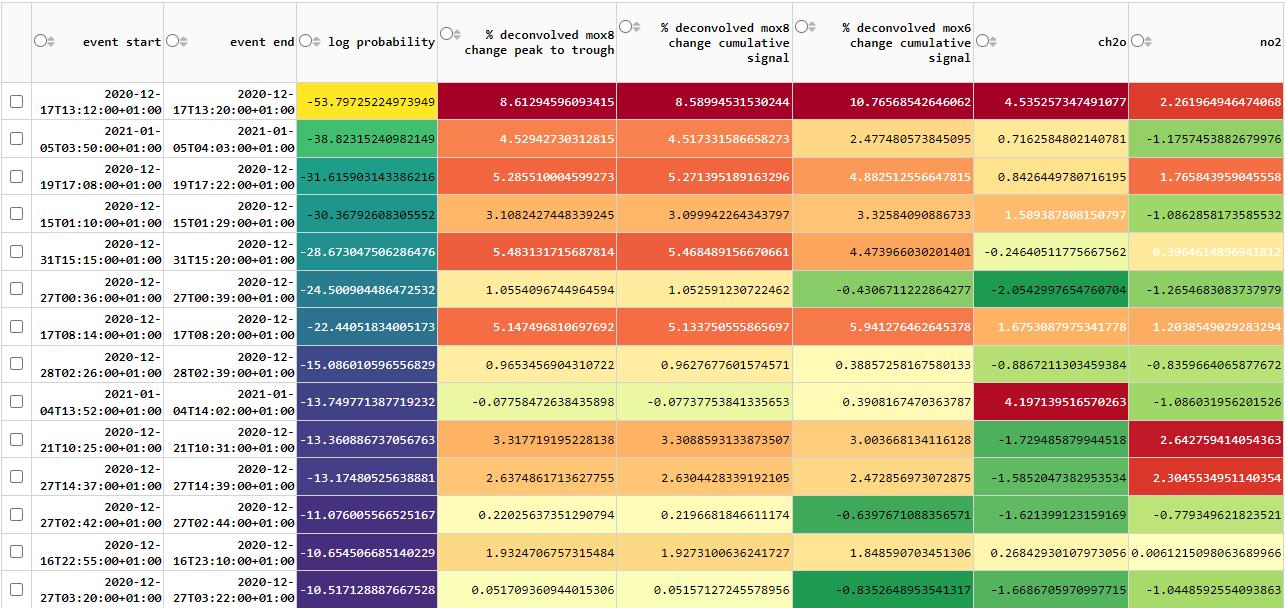
- Events were “scored” by fitting a Multivariate Gaussian model to their sensor feature array: the higher the score of the event, the higher the anomaly (i.e., the most improbable the event is under the assumption of the multivariate normal distribution).
- Events could thus be filtered in and out according to the probability of their multisensory signature: the engineer could focus on the outliers (that is, the anomaly encountered in the environment), or on the contrary filter out the outliers to decipher patterns in the population of more “normal” events.
- Upon hover on an event data point, the original multisensory signature was reconstructed on a radar plot. This was important to convert the event from an abstract statistical score in principal component coefficient or probability, back to an atmospheric meaningful measure (the concentration of a volatile compound).
- Export the final table of events. This table could then be included in the deliverables or used as an input to other statistical visualization or analysis routines.
The challenge of industrializing a webapp
Section titled [object Undefined]We initially chose the Dash framework to organize this workflow because:
- It is easy to setup and experiment with in local development mode.
- It provides a very pleasant responsive user interface that can effortlessly be modified or extended with HTML/CSS.
- It was a straightforward wrapper of our in-house Python data analysis stack and Plotly-based statistical visualization library5.
Deploying the application to a production server would have required additional developments:
- Rewrite our middleware component in Python to orchestrate authentication & device/site selection.
- Set up an in memory database or server side storage for the results of queries and intermediate computations: Dash is a stateless framework, such that user session variables has to be stored on the client side (i.e., in the browser). Serializing/deserializing data and models for transfer between client and server sides constitutes the principal performance overhead of this framework, especially when working with time-series data.
Outlook of the project
Section titled [object Undefined]These efforts did not fit well with the development roadmap of the company’s analytics platform.
We thus decided to:
- Keep the stack as a standalone Python toolbox to be used by data scientists in their local environment. The event segmentation and quantification algorithm became a classical processing pipeline used by the team for applicative support.
- Implement data processing components used in this stack as modules in the backend of the platform. Our first effort was to develop an online version of the algorithm for signal differentiation and peak detection, which could then feed an “event scorer” module.
Additional resources
Section titled [object Undefined]Dash Extensions, a package to extend and circumvent native Dash limitations
Anomaly detection using multivariate gaussian distribution by Andrew Ng